
Create Your Own Network Assessment Appliance: Additional Tools
Introduction
I previously did a write up on a personal virtual machine I like to keep at hand for performing network analysis and discovery. I’ve since added a few tools to the VM and documented how they were installed so I figured I’d share on how it was done. Even if you don’t setup everything in this post it may be worthwhile to glance through it for some network engineering tools which are free to setup and use but not highly publicized. Anyone who cares to read this post has likely heard of Solarwinds but I highly doubt you have heard of all the tools in this list (let alone how to set them up). Regardless, I’ll start with a tool anyone worth their salt has heard of though, Cacti…
Cacti 0.88
Site: http://www.cacti.net
Purpose
Cacti is a complete rrdtool performance trend analysis tool. I’ve been using it for years and can attest to its robustness. Many of the programs I’m covering have plugin capabilities to integrate Cacti so I decided to set it up first. I also added a ton of third party add-ons and templates to try to cover the gambit of what you may need in an environment. To an extent all the extras make Cacti a fairly capable alerting system as well.
Cacti terms itself as;
…a complete network graphing solution designed to harness the power of RRDTool‘s data storage and graphing functionality. Cacti provides a fast poller, advanced graph templating, multiple data acquisition methods, and user management features out of the box. All of this is wrapped in an intuitive, easy to use interface that makes sense for LAN-sized installations up to complex networks with hundreds of devices.
Setup
I not only installed Cacti, but I loaded it up with addons.
Install snmpd so we have some test data to graph out to confirm everything is working.
Go to http:///cacti to complete the rest of the installation.
I had initially installed via apt-get but the repository only has an older version of cacti. After apt-get removing the install, rrdtool was all confused on where the graphs and scripts were supposed to be so I had to rebuild the poller cache. You may not have to do this but if you do then run the following.
Then manually kick off the poller:
Cacti Extra Templates
I went ahead and setup a handful of host/graph templates from http://docs.cacti.net/templates. Here is how it was done:
Cacti Extra Plugins
Now do the same for plugins to get cool things like weathermap, threshold notifications, switch/router config backups, and network discovery:
Go to http:///cacti/plugins.php and enable your plugins
Go to http:///cacti/settings.php and in the “Misc” tab change your settings for the realtime cache directory to be /var/www/cacti/plugins/cache/ (consequently, this is also where you go to setup the discover plugin subnets)
Go to http:///cacti/user_admin.php, select the admin user, then under realm permissions ensure that the MacTracker items are selected.
When all is said and done you should have a bunch of extra Cacti areas to play around in and mess up (that is up to you to figure out and fix).
360-FAAR
Site: http://www.360analytics.co.uk/360faar/
Purpose
This nifty script is self-described in the following excerpt from its readme.txt file,
360-FAAR (Firewall Analysis Audit and Repair) is an offline, command line, Perl firewall policy manipulation tool to filter, compare to logs, merge, translate and output firewall commands for new policies, in Checkpoint dbedit, Cisco PIX/ASA or ScreenOS commands, and its one file!
Read Policy and Logs for:
Checkpoint FW1 (in odumper.csv / logexport format),
Netscreen ScreenOS (in get config / syslog format),
Cisco ASA (show run / syslog format),
360-FAAR uses both inclusive and exclusive CIDR and text filters, permitting you to split large policies into smaller ones for virtualizations at the same time as removing unused connectivity.
360-FAAR supports, policy to log association, object translation, rulebase reordering and simplification, rule moves and duplicate matching automatically. Allowing you to seamlessly move rules to where you need them.
TRY: ‘print’ mode. One command, and spreadsheet for your audit needs!
I’ll be honest and say I’ve yet had the opportunity to use the script but it sounds pretty cool in what it does. Also, the developers are constantly updating it so if you do use this on a regular basis you may want to follow the project on freecode.com.
Setup
FAAR is just a perl script so there is not much needed besides some perl libraries and a location to put the script. I’ve been putting the single use command line tools in the ~/Applications directory up to this point so that is where FAAR is going to go.
Gestioip
Site: http://www.gestioip.net/
Purpose
I don’t believe an IP address management application is really related to the discovery type nature of the appliance but I thought I’d include one regardless. This is due to how many people I see still using spreadsheets to manage their network IP addresses.
I was initially going to setup phpip but I tried and tried and, for the life of me, couldn’t get phpip to work. (This is likely due to how massively aged and ignored the project has become.) Thus my switch to Gestioip for IP address management.
After getting everything configured I was pleasantly surprised to find additional IPv6 migration and configuration features I’ve not seen in any other product. This automatically boosted the awesomeness of this free tool in my head and therefore it gets a spotlight in my toolkit.
GestioIP terms itself as;
GestióIP is an automated, Web based IPv4/IPv6 address management (IPAM) software. It features powerful network discovery functions and offers search and filter functions for both networks and host, permitting Internet Search Engine equivalent expressions. This lets you find the information that administrators frequently need easily and quickly. GestióIP also incorporates an automated VLAN management system.
Setup
Accept all the default prompts and follow the directions for creating the read-only and admin users and everything should “just work” when it completes.
Read-Only: gipoper/admin
Admin User: gipadmin/admin
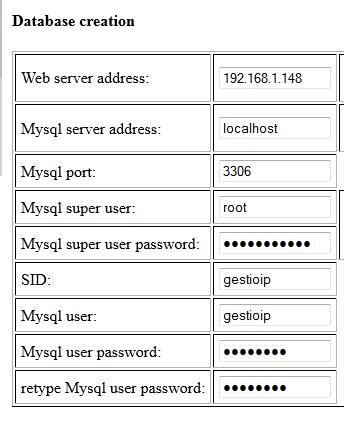
Now go to http:///gestioip/install/ and run through the database install process. I used the following information to complete the installer:
Although I got all green Oks at this step the next step failed with a database access error. To get around this I manually assigned the rights for the gestioip user on the gestioip database like so:
I was then able to continue configuration. I used a basic main office site and the pre-defined network categories:
Finally remove the install directory and then go ahead and access for freshly installed, web-based, IP address management solution.
GestioIP Usage
When first using GestioIP you will probably want to create a root network per physical site which contains a supernet of all of your subnets then add all the routed subnets. If this is not your network you can still use the GestioIP application for some rudimentary discovery.
There are some cool import/export functions you can use as well:
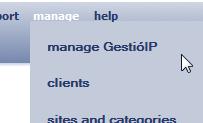
Under the manage -> manage GestioIP at the very bottom of the screen is where you go to reset the database for a new client site.
GestioIP Extra Surprise Feature
One of the coolest features (which I didn’t realize I was getting until I started poking around the app) is an IPv6 Address Planner. The planner takes you from beginning to end in creating a hierarchy for your organization. There are two options when planning. Both options start out with you putting in your IPv6 address block.
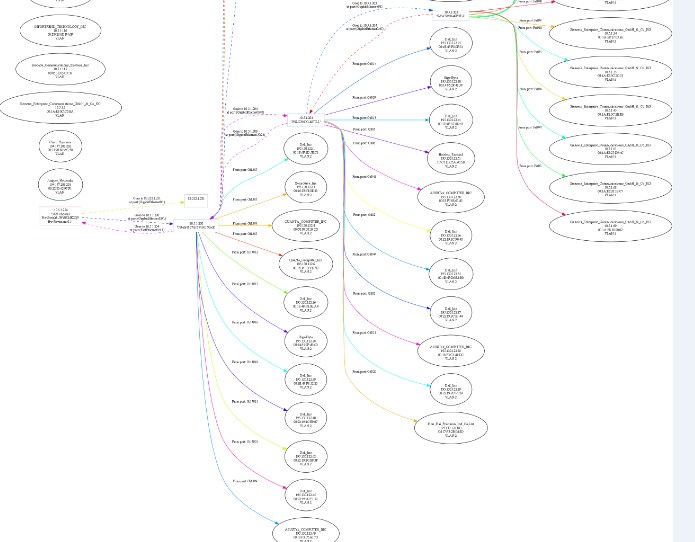
The second option helps you come up with a new site plan based on number of sites and category of IP addresses (prod, dev, test, et cetera). This can be quite valuable in helping plan your network and preventing IP subnet fragmentation moving forward. Below is the output for creating a new IPv6 address plan for one site that contains corp, dev, and test categories and planning for 2 sites (each having 4 root networks being reserved).
I wish I could say I used this to plan an IPv6 migration but I’d be lying if I did. But I will say (from staying intellectually current in the industry) that this is a feature which I would use if performing such an upgrade. This is top-notch stuff for a free tool. Definitely worth checking out.
NETDISCO
Site: http://www.netdisco.org
Purpose
Netdisco terms itself as;
… an Open Source web-based network management tool first released publically in 2003. The target users are large corporate and university networks administrators. Data is collected into a Postgres database using SNMP and presented with a clean web interface using Mason.
Configuration information and connection data for network devices are retrieved via SNMP. Data is stored using a SQL database for scalability and speed. Layer-2 topology protocols such as CDP and LLDP provide automatic discovery of the network topology. Here are some of the favorite uses for this tool:
- Locate a machine on the network by MAC or IP and show the switch port it lives at.
- Turn Off a switch port while leaving an audit trail. Admins log why a port was shut down.
- Inventory your network hardware by model, vendor, switch-card, firmware and operating system.
- Report on IP address and switch port usage: historical and current.
- Pretty pictures of your network.
Netdisco gets all its data, including topology information, with SNMP polls and DNS queries. It does not use CLI access and has no need for privilege passwords.
Setup
A long time ago I had setup netdisco and recall the install process to be rather painful. Thus I had avoided it for quite a while. Since I’m making a discovery appliance I’d be doing netdisco a great disservice by not including it along for the ride. I chose the cheesy way of doing the install and just used apt at first but it wasn’t up to date so I uninstalled and reinstalled by hand. It was just as painful to get working this time as it was the last *sigh*. I believe I captured the right steps to get netdisco working on my VM but if I missed something please let me know.
I used a good portion of the installer script another person posted online.
Finally, go through and modify the config file for your environment:
Access the netdisco interface at http:///netdisco with admin/admin
Among other excellent features there are some cool reports for discovery:
NTD – Network Topology Diagrammer
Site: http://www.sivann.gr/software.php#ntd
Purpose
I stumbled across this one while I was looking at another software product this kind programmer gives away for free, ITDB. I’m going to wait for the auto-discover feature for that product before installing. But NTD looks worthy to setup and use right now. Here is how it is done.
Setup
Then access via a browser by going to http:///ntd/ntd.php, put in your default gateway, click run, and wait a bit for your results.
The png output file never seems to generate but it does generate a graphviz file which you can use to create some pretty nice looking diagrams.
SMART – Safe Mapping And Reporting Tool
Site: http://safemap.sourceforge.net/
Purpose
This one flew right under my radar when it was released. To top it off, it was released by Cisco then promptly dumped for whatever reason (looks like the team responsible for it got dissolved internally at Cisco).
SMART is a passive network visualization tool. It is self-proclaimed as:
The Safe Mapping and Reporting Tool (SMART) is a completely passive network flow visualization tool for small to medium sized IP networks featuring device and operating system identification and network service enumeration.
…
SMART can also process packet capture files from tools like tcpdump or ethereal/wireshark in pcap format, adding network flow visualization to your forensic toolkit.
Setup
Then to run the packet capture:
On linux systems you will need to be root to run smart.pl in promiscuous mode to capture packets from your LAN (-p option).
As a typical use example, suppose your local network includes the 192.168.x.x and 10.x.x.x netblocks. From a linux host, you would execute smart.pl as follows:
– This would label web pages produced by SMART with “My Net” (-N)
– The flowlog would be saved in XML format (-x)
– Packets would be captured in promiscous mode (-p)
– Debug mode would be enabled (-d)
– eth0 would be the packet capture interface (-i)
– The flowlog and the web pages would be updated every 20 secs (-t)
– The 192.168.x.x and 10.x.x.x netblocks would be considered the local “LAN” for the Lan Focus displays in the web interface.
You can also specify -r to just read from a pcap file. The interactive website does require the Adobe SVG Viewer be installed on your computer. Some output just from my home network:
Extras
Here is a list of extras I added into the mix for other network management tasks. Some do monitoring, others are for maintaining documentation. They are not really discovery related but worth having if you are in a more permanent environment.
phpFileManager
Site: http://phpfm.sourceforge.net/
Purpose
I set this up mainly to access the files within the netcollect user home directory. I know there are other flashier web based file managers but this is easy and it works for my purposes. Here is how to set it up.
Setup
Add the following to /etc/apache2/ports.conf
Listen 82
Then access the web file manager by going to http://:82/
Shinkin
Site: http://www.shinken-monitoring.org/
Purpose
Shinken describes itself thusly;
Shinken is an open source Nagios like tool, redesigned and rewritten from scratch. Its main goal is to meet today’s system monitoring requirements while still allowing compatibility to Nagios®
Setup
You then can login at http://:7767 with admin/admin
Note that, despite the simple installation, Shinken is a very comprehensive program with logs of options for discovery, monitoring, and integration. You will really want to get more info on configuring this bad boy from their site.
RackTables
Site: http://racktables.org/
Purpose
This is not really a discovery related addition but can be nice to have in your environment for proactive infrastructure documentation. RackTables as defined by its creators:
Racktables is a nifty and robust solution for datacenter and server room asset management. It helps document hardware assets, network addresses, space in racks, networks configuration and much much more!
Setup
Go to the following site to start the installer: http://192.168.1.148/racktables/wwwroot/?module=installer
Follow the install, ignore the warnings and use the database of racktables with the user and password of racktables/racktables. Set whatever admin password you like. I’m super original so I just set it to be racktables. After this is done you can access and setup Racktables.
Netdot
Site: https://osl.uoregon.edu/redmine/projects/netdot
Purpose
Netdot developers say that Netdot is:
Network Documentation Tool project
Netdot is an open source tool designed to help network administrators collect, organize and maintain network documentation.
Setup
I’ve really wanted to try this one out for years now but I’ve never been able to successfully get it running…and I still cannot unfortunately. Maybe you will have better luck with directions at this post online. I went through the following steps before I got stuck at the final stages of the install 🙁 I’m going to note this to be possibly revisited at a future date as it really does seem to be a cool networking tool.
Conclusion
I hope this article broadens the consciousness of some of the great open source tools at the disposal of today’s network analysts and administrators.