
Use Powershell to Create a Windows Service Dependency Diagrams
I use powershell with graphviz to generate color coded service dependency diagrams for windows services. Besides creating useful and beautiful diagrams for your environment, this will also provide some interesting functions for gathering remote service information with alternate credentials.
Description
It seems like I come across something begging for a solution every day in my industry. For instance, I was working on performing a full dependency relationship table for services across my infrastructure and I got to thinking how cool it would be to have the ability to quickly create dependency diagrams for the services running on a server. Not finding anything free or simple, I whipped up a quick powershell script with a recursive function to utilize the built in cmdlets and return services, their dependencies, the dependencies of the dependencies, and so on. I then hacked this data into a template file for graphviz’s dot.exe diagram generation tool.
This probably should have been good enough but I wanted to also be able to do the same across multiple servers using alternate admin credentials. I found myself unrolling the solution into several sub-functions when get-service simply wasn’t filling my needs. This lead me to a better understanding of wmi and powershell functions in general. The end results are the following functions:
To actually generate the diagrams you will need graphviz’s dot.exe executable which can be downloaded and installed here. Or here is a portable version of the application you can try utilizing. All you need is for the dot.exe file to work correctly to generate your diagrams though. You may have to modify this script to use the appropriate path to the executable if you use the portable version of graphviz.
Version
Version : 1.0.0 June 16th 2013
– First release
Notes
I included several functions in this exercise but I didn’t create any separate functions for the actual dot file generation. This is largely because there are so many ways this can be done. By default this script will create dependency diagrams which include hidden services in the dependency tree (as dashed nodes). This will also color code the nodes based on the status of the service.
The primary function you will use to create the dependency tree is the Get-RemoteServiceDependencyTree function. Here are three examples on how you might generate this data.
Screenshots
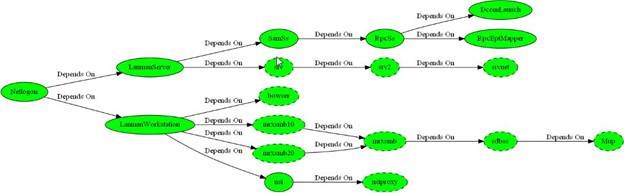
Here is a diagram generated for the netlogon service (remotely to a test DC of mine for what it is worth).
Here is a more complex diagram depicting all of the services with “exchange” in the name on an exchange 2010 mailbox.
Conclusion
This may be a good starting point for documentation of some of the essentials services running on your servers. Or if you are simply interested in to flow of service dependencies and need a good visual to understand them on your servers, this should certainly help you out.
Downloads
Download the script from the technet gallery (more frequently updated)
Download the script from this site (less frequently updated)